
Shea Theodore and Brandt Clarke are separated by fewer than four picks in Yahoo ADP.
Same position. Same part of the draft. Easy comparison, right?
Not even close.
Using my league settings, Cracked Ice projects Clarke slightly ahead in fantasy points per game. Kodo flips it to Theodore. Dom's projection puts Theodore well ahead. Apples & Ginos also prefers Theodore, but has Clarke much closer.
If I average everything together, I get one clean answer: Theodore.
Clean answers are comforting. They can also hide the most useful part of the whole exercise.
Why did one source prefer Clarke? Why were two sources so much more aggressive on Theodore? Is the difference coming from power-play production, shots, blocks, expected games, or something else? And once I add my league scoring, roster needs, and schedule, is Theodore still the better pick for my team?
That's the part I actually care about.
I don't need another list telling me Player A is 74th and Player B is 79th. I want to know what each ranking is betting on, where those bets disagree, and which assumptions I'm willing to draft.
So I imported four projection views into Cracked Ice, scored them under the same league settings, built a selected-source consensus, and started looking for fights.
There were plenty.
Method note: The screenshots and featured Theodore–Clarke values below use the same saved Chesterfield League scoring setup and the same four-source consensus. The examples are limited derived comparisons, not a reproduction of any paid projection dataset.
If you only want the useful part
Pick two players. Choose last season, one projection source, or your selected-source consensus. Cracked Ice scores both players for your league, then shows the projected stat lines, value above replacement, roster fit, regular-season schedule, and fantasy-playoff schedule behind the recommendation.
That's the whole feature. The rest of this article is about why I built it this way and what I learned when the projection sources disagreed.
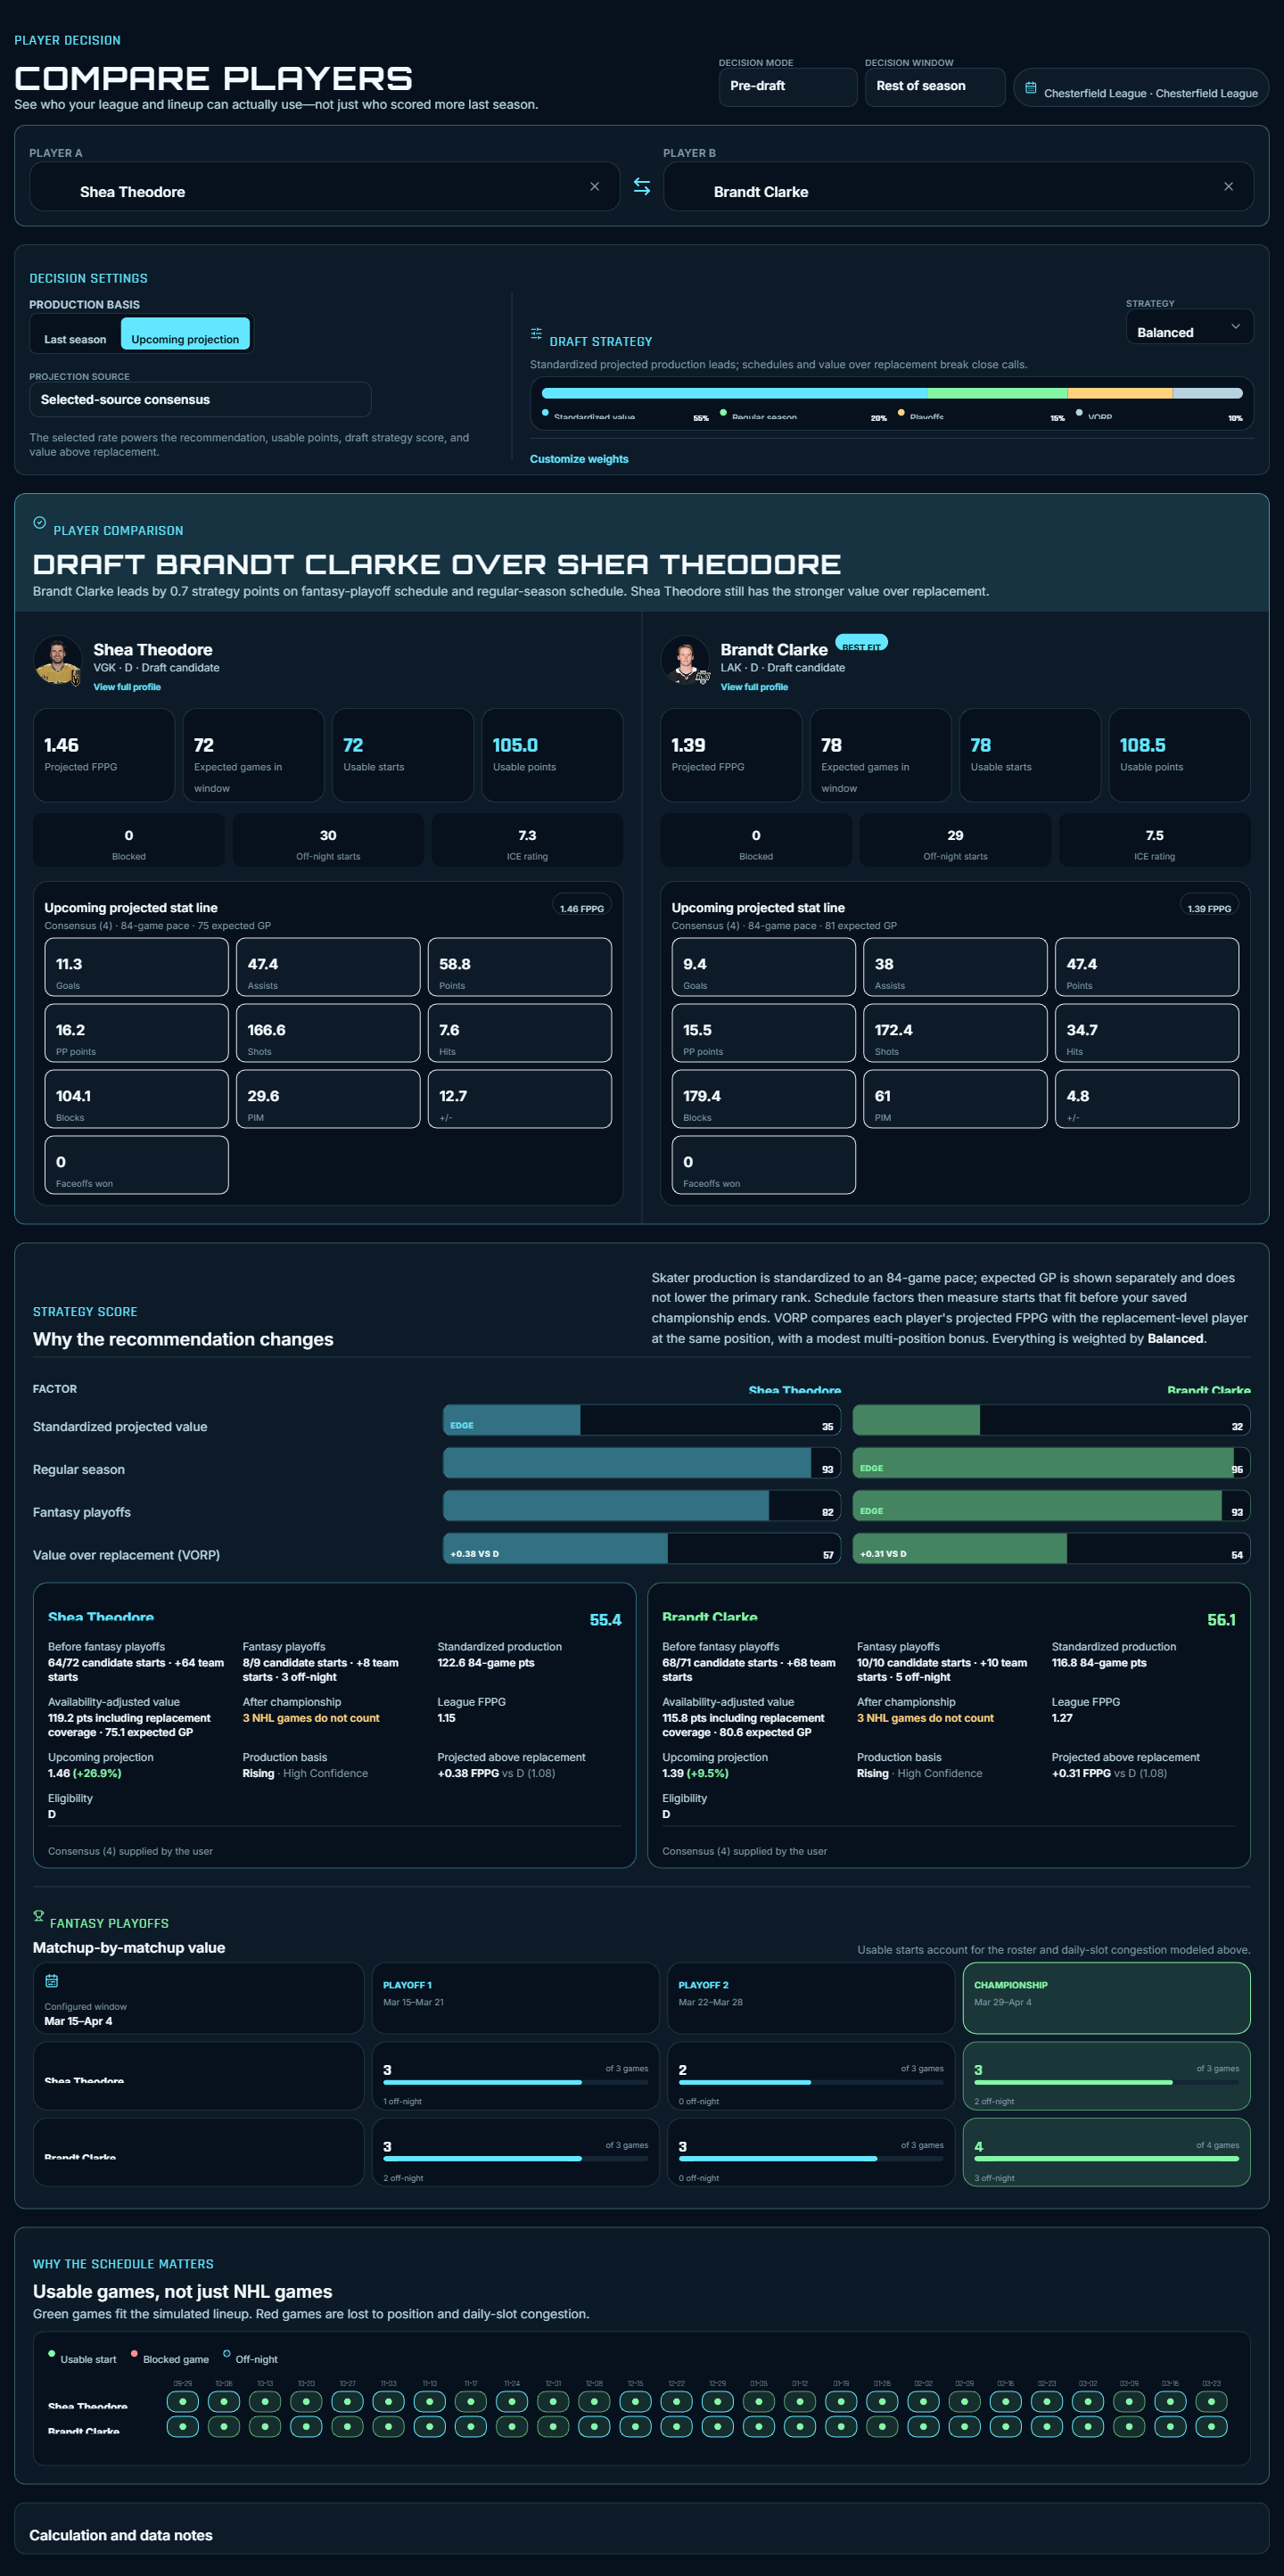
The complete Theodore–Clarke comparison using my selected-source consensus and league settings. Open the full-size image to inspect the projected stat lines, VORP, roster fit, regular-season schedule, and fantasy-playoff context.
Four projection systems, one scoring setup
For this test I used:
- Cracked Ice's early projection
- Kodo
- Dom's projection list
- Apples & Ginos
My imported sources stay inside my own league workspace. Cracked Ice matches the players, applies my league's scoring to the stat lines I supply, and lets me decide which sources actually belong in the consensus.
The consensus is equal-weighted. It's not Cracked Ice quietly deciding which expert deserves 37 percent of the vote because a regression model said so.
For skaters, I put the projected stat categories on the same 84-game pace before averaging them. Expected games stay visible as their own separate workload estimate. That distinction matters. A guy shouldn't become a worse rate projection just because one source expects him to miss ten games. I still want to see the injury and workload risk. I just don't want it smuggled into every other number.
One more limitation: Cracked Ice's category line is an early model based on prior production mix, adjusted to its projected rate and games. Imported sources use the actual forward-looking category lines they supply. That's useful for finding disagreements, but it doesn't magically turn every input into the same kind of projection.
I kept this comparison to skaters. Goalie files use games and starts differently, and I'm not letting a spreadsheet-column argument decide the headline.
The ranking is the least interesting column
Here is a small sample from my league setup:
| Player | Yahoo ADP | Cracked Ice | Kodo | Dom | Apples & Ginos | Selected consensus |
|---|---|---|---|---|---|---|
| Connor McDavid | 1.5 | 3.40 | 3.47 | 3.25 | 3.05 | 3.29 |
| Jack Hughes | 18.5 | 2.59 | 2.87 | 2.70 | 2.42 | 2.65 |
| Brady Tkachuk | 23.6 | 2.28 | 2.45 | 2.01 | 1.95 | 2.17 |
| Shea Theodore | 100.8 | 1.20 | 1.31 | 1.69 | 1.64 | 1.46 |
| Beckett Sennecke | 102.7 | 1.58 | 1.99 | 1.78 | 1.56 | 1.73 |
| Brandt Clarke | 104.5 | 1.23 | 1.26 | 1.46 | 1.61 | 1.39 |
Projected FPPG under the same saved league scoring. Values are rounded, so a displayed spread may differ by 0.01 from the unrounded calculation.
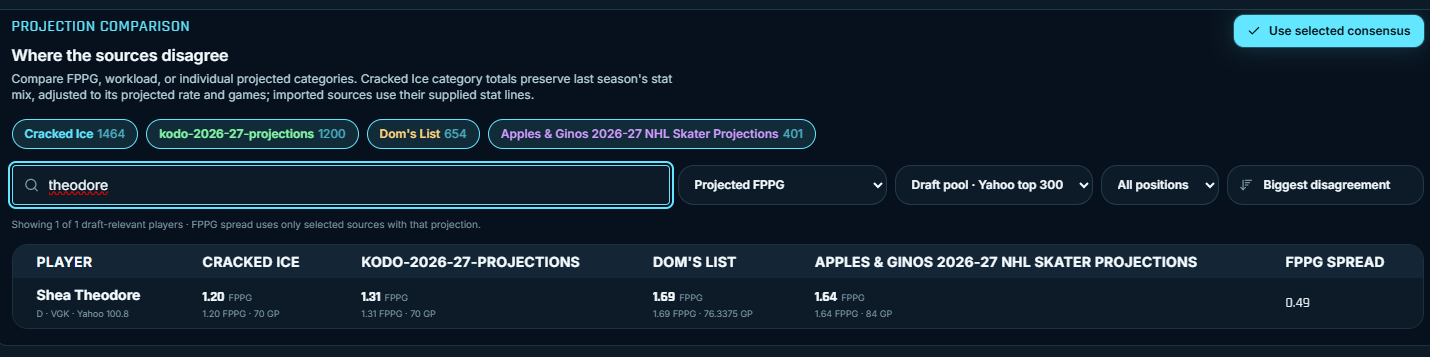
Shea Theodore ranges from 1.20 to 1.69 projected FPPG. The equal-weighted four-source consensus is 1.46.
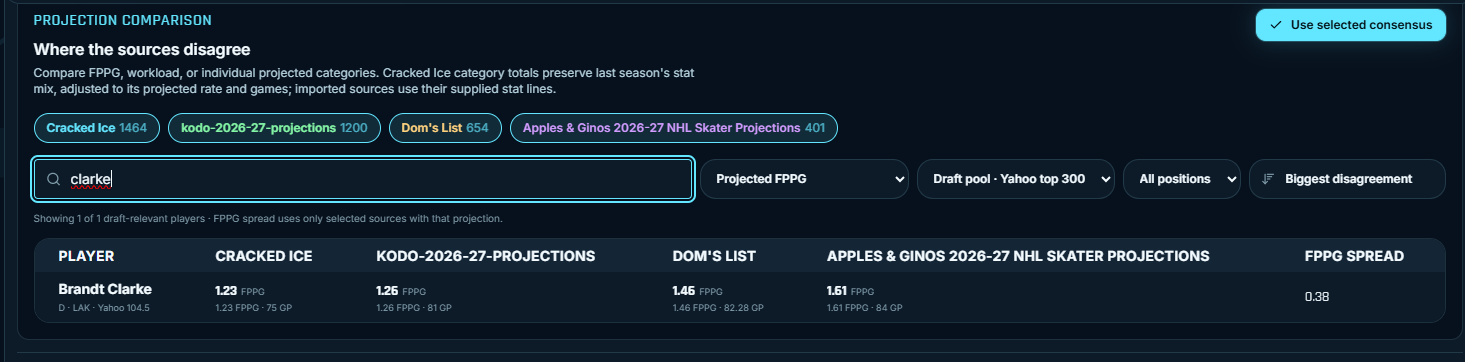
Brandt Clarke ranges from 1.23 to 1.61 projected FPPG. The equal-weighted four-source consensus is 1.39.
I can turn that into a consensus ranking in about two seconds.
But look at Theodore and Clarke again.
The consensus prefers Theodore, 1.46 to 1.39. That sounds decisive enough to stop thinking. The source-level view says something much more interesting:
- Cracked Ice has Clarke narrowly ahead.
- Kodo has Theodore narrowly ahead.
- Dom has Theodore comfortably ahead.
- Apples & Ginos has Theodore ahead, but is also the most optimistic source on Clarke.
The question is no longer "Who ranks higher?"
The question is "What has to happen for this projection to be right?"
That's a draft decision.
McDavid is the control group
The Connor McDavid row is useful precisely because it's boring.
All four systems agree he's absurd. The range from 3.05 to 3.47 FPPG isn't small in raw fantasy points, but no source is uncovering a secret reason to fade Connor McDavid. If your model comes out of this exercise recommending a clever alternative at first overall, the model has probably become too clever for its own good.
Consensus helps here. Four independent paths arrive in roughly the same neighbourhood. I can stop searching for a fight that doesn't exist.
That's one job of a consensus: tell me where disagreement is not worth my time.
Brady Tkachuk is where league scoring starts the argument
Brady's spread is much more interesting.
Kodo lands at 2.45 FPPG in my setup. Apples & Ginos lands at 1.95. That's half a fantasy point per game between the high and low ends, for a player going in the second round.
Over a full fantasy season, that's not rounding error. It can change whether Brady belongs beside the elite forwards or in the next tier.
It also screams for a category check.
Brady is exactly the kind of player who exposes lazy consensus building. Goals, shots, hits, penalty minutes, power-play production, and league scoring all pull on his value. Two sources can project a similar real-life season and still produce meaningfully different fantasy values if they disagree about the shape of that production, or if my league rewards the shape differently.
A single consensus FPPG tells me where the average landed. The category comparison tells me why.
That's where I'd stop reading the ranking and open the full player comparison.
Jack Hughes shows why I still want the individual sources
Jack Hughes ranges from 2.42 to 2.87 FPPG across the four views.
Every source likes the player. They don't agree on the price.
At 2.87, I'm looking at a player who can justify an aggressive first-round decision in the right league. At 2.42, I still want him, but the opportunity cost changes. Suddenly I care a lot more about who else is on the board and how many centers or left wings I already have.
The consensus lands at 2.65. Reasonable. Useful. Also slightly dangerous, because it makes the disagreement disappear.
If the high projection is driven by a production jump I believe in, I may want to draft Hughes ahead of the consensus. If it's mostly an optimistic games-played assumption, I may not. Those are completely different bets hiding behind the same average.
I don't want Cracked Ice to pick the belief for me. I want it to put the belief on the screen where I can argue with it.
Beckett Sennecke is an upside test, not an average
Sennecke runs from 1.56 to 1.99 FPPG.
That's a huge gap for a player around pick 100. The low end says useful depth. The high end says I may be drafting a breakout before the room fully pays for it.
The consensus settles at 1.73.
Fine. But nobody drafts a young player because 1.73 feels spiritually balanced.
I'm drafting him because I think the opportunity, role, and scoring growth can land closer to the aggressive projection than the cautious one. Or I'm passing because I think the market has already priced in too much of that breakout.
This is where I want the comparison beside a safer player at the same draft price. Give me Sennecke's ceiling case, the other player's floor, their projected category shapes, and what each one does for my roster. Then let me make the call.
Consensus finds the argument. Player Compare is where I decide whether I believe it.
Theodore versus Clarke is the feature
This is the comparison I'd put on the cover.
Yahoo prices them four picks apart. Both are defensemen. The consensus prefers Theodore. One source still puts Clarke ahead, and another is much more bullish on Clarke than the rest.
That's already more useful than a single rank, but the actual decision needs another layer.
When I open Player Compare, the projection source is only the production basis. Cracked Ice can then add:
- value over replacement at defense
- my current roster and open positions
- projected usable starts rather than raw NHL games
- off-night access
- my saved fantasy-playoff window
Now I can change from Cracked Ice to Kodo, Dom, Apples & Ginos, or the selected-source consensus and watch the production side of the decision move without losing the league and schedule context around it.
The full comparison above uses the selected-source consensus. Switching the projection basis can change the recommendation while the league, roster, scoring, and schedule settings stay the same.
That's the tool I wanted.
Not four browser tabs. Not a private spreadsheet with six VLOOKUPs held together by spite. One comparison where I can see the sources disagree, understand the category bet, and then ask whether the difference even matters to my roster.
Would I automatically take Theodore because three of four sources have him ahead?
No.
I'd take Clarke.
The consensus prefers Theodore, but I'm betting on the upside. Los Angeles hired Peter Laviolette, who has openly talked about producing more offense, and Clarke is the right age for a breakout if the new staff gives him more room to attack. That's the bet I'm willing to make even though the average points the other way.
That's also why I don't want the consensus to make the decision for me. It tells me where the sources land. The comparison helps me see exactly what I have to believe to disagree with them.
The tool should make that trade-off obvious. It shouldn't pretend the trade-off disappeared.
What consensus is actually good for
After working through the board, I think consensus has three useful jobs.
First, it lowers the risk that one strange projection hijacks my entire draft. If one system loves a player and three are much colder, I want to know before I reach two rounds.
Second, it tells me where to spend my research time. I don't need another hour on McDavid. I may need another hour on Theodore, Clarke, Sennecke, or any player whose sources are making completely different bets.
Third, it gives me a neutral starting point for Player Compare. I can use the consensus first, inspect the recommendation, and then switch sources to see what assumption is actually capable of changing the answer.
What consensus can't do is turn uncertainty into truth.
Four projections can all miss the same role change. An injury can wreck the most careful workload estimate. A new power-play unit can make every August spreadsheet look silly by October.
The average isn't the answer.
It's the place I start asking better questions.
The draft workflow I actually want
This is how I expect to use it:
- Import the projection sources I'm licensed to use.
- Select the sources I trust for the consensus.
- Apply my actual league scoring.
- Filter to draft-relevant players and sort by biggest disagreement.
- Inspect the category that's creating the gap.
- Send the closest decisions into Player Compare.
- Save my preferred player and a backup to the draft plan.
The last step matters, but I'm not building this article around an availability percentage. Human draft rooms are messy, keepers compress the player pool, and one manager reaching can blow up a beautiful probability before the coffee gets cold.
The planner is where I record the decision. The comparison is where I earn it.
My takeaway
I started by wanting a consensus ranking.
I ended up liking the disagreement table more.
A consensus is useful when I need one stable production baseline. It's much more useful when I can break it back open, see which source is making which bet, and test that bet against my scoring and roster.
That's the difference between collecting rankings and making a decision.
If two players are close in your draft, send me the names and your scoring settings. I want to see which comparisons hold up, and which ones start a fight.
Import your projections and compare the players in your league